
To see where your cash is sitting, work out three numbers in days. Stock days: how many days of buying are sitting in your godown. Receivable days: how many days of sales your customers still owe you. Payable days: how many days of buying you have not yet paid for. Add the first two and subtract the third. The answer is roughly how many days your money waits between paying for materials and being paid by customers. Then turn the days into rupees: one day less stock frees about one day of purchases, and one day less owed by customers frees about one day of sales. A sensible place to start is whichever of stock or customer balances holds more of your money; compare the rupees as well as the days, because one day of sales and one day of purchases are different amounts.
Profit is not cash: where it sits
A business can make a profit every month and still be short of money in the bank. The profit is real, but much of it is not in the bank yet. Some of it is sitting as stock you have bought and not yet sold. Some is owed by customers who have been invoiced and have not paid. Against that, some of what you have bought is not yet paid for, so suppliers are carrying part of it for you. The three day counts show how big each of those is, in a unit you can compare from one quarter to the next.
The five numbers you need
From your balance sheet, or the lists behind it, at the same date:
- Stock: the value of stock on hand.
- Receivables: what customers owe you.
- Payables: what you owe suppliers.
From your profit and loss statement for the year:
- One day of sales: yearly sales ÷ 365.
- One day of purchases: yearly purchases ÷ 365.
Ask your accountant which cost figure and which balances to use for your business. Some accountants prefer a different cost figure from purchases, or averages instead of closing balances. Whichever you use, use the same figures the same way each time, so the results can be compared.
Stock, receivable and payable days in plain words
| Count | Calculation | In plain words |
|---|---|---|
| Stock days | Stock ÷ one day of purchases | How many days of buying are sitting in stock |
| Receivable days | Receivables ÷ one day of sales | How many days of sales customers still owe |
| Payable days | Payables ÷ one day of purchases | How many days of buying you have not paid for yet |
Days your cash is tied up
Days tied up = stock days + receivable days − payable days
This is your working capital cycle in days; accountants sometimes call it the cash conversion cycle. A shorter figure means money comes back to you sooner; a longer one means it waits longer in stock or with customers. There is no single right figure. It depends on what you make or sell and the terms in your trade, so compare it with your own earlier figures, not with anyone else's.
Turn days into rupees
Days are easier to compare; rupees are easier to act on.
- One day less stock frees about one day of purchases.
- One day less owed by customers frees about one day of sales.
Which one to work on first
Ask three questions:
- Does stock hold more of your money than customers owe you? Compare the two balances in rupees as well as stock days and receivable days. Look at what is sitting unsold or slow-moving, and how much you reorder each time.
- Do customers owe you more than you hold in stock? Look at which customers are paying later than agreed, and why.
- Are you paying suppliers well before customers pay you? Then the gap has to be carried by your own money in the meantime. That is worth knowing when you agree terms with a new customer. It is not a reason to pay suppliers late; pay them on the terms you agreed.
Work out the figures the same way every quarter and compare each one with your own last figure. The trend tells you more than any single result.
To plan the next few weeks of cash one week at a time, see our 13-week cash plan guide.
Worked example: a packaging maker's year
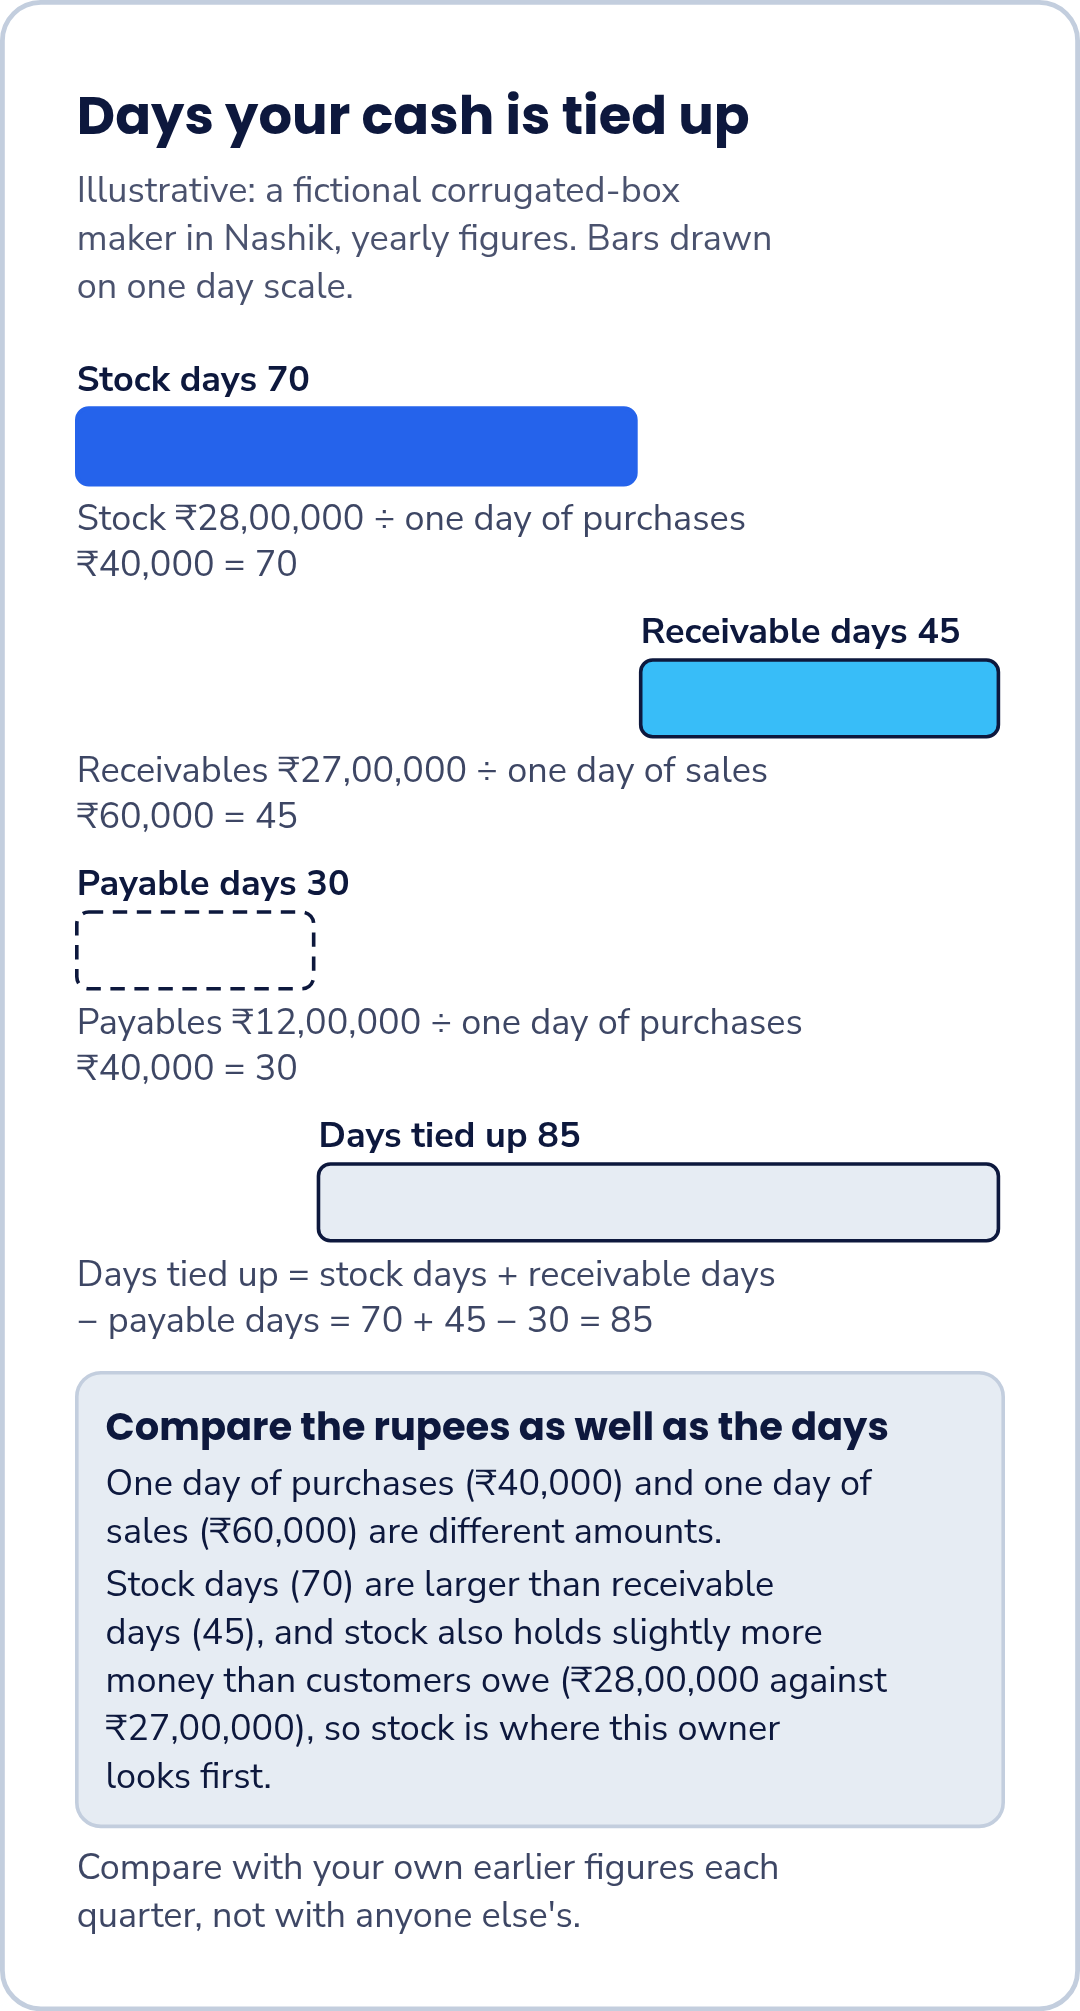
Illustrative example: a fictional corrugated-box maker in Nashik; yearly figures. The business and figures are invented.
| Input | Figure | Per day |
|---|---|---|
| Yearly sales | ₹2,19,00,000 | ₹2,19,00,000 ÷ 365 = ₹60,000 |
| Yearly purchases of materials | ₹1,46,00,000 | ₹1,46,00,000 ÷ 365 = ₹40,000 |
| Stock | ₹28,00,000 | |
| Receivables | ₹27,00,000 | |
| Payables | ₹12,00,000 |
| Count | Calculation | Days |
|---|---|---|
| Stock days | ₹28,00,000 ÷ ₹40,000 | 70 |
| Receivable days | ₹27,00,000 ÷ ₹60,000 | 45 |
| Payable days | ₹12,00,000 ÷ ₹40,000 | 30 |
| Days tied up | 70 + 45 − 30 | 85 |
Stock days (70) are larger than receivable days (45), and stock also holds slightly more money than customers owe (₹28,00,000 against ₹27,00,000), so stock is where the owner looks first. Because stock here includes work in progress and finished boxes as well as raw materials, dividing by materials purchases is a simplification; the accountant may suggest a different cost figure.
In rupees. If stock were 55 days instead of 70, it would be 55 × ₹40,000 = ₹22,00,000. That would free ₹28,00,000 − ₹22,00,000 = ₹6,00,000, which is the same as 15 days × ₹40,000. The 55 days is only an illustration of how the arithmetic works, not a target.
Calculator
Fill in the blanks with your own figures, at the same date and in the same way each quarter.
Yearly sales            ₹[ ]   ÷ 365 = one day of sales       ₹[ ]
Yearly purchases        ₹[ ]   ÷ 365 = one day of purchases   ₹[ ]

Stock                   ₹[ ]   ÷ one day of purchases = stock days        [ ]
Receivables             ₹[ ]   ÷ one day of sales     = receivable days   [ ]
Payables                ₹[ ]   ÷ one day of purchases = payable days      [ ]

Days tied up = stock days + receivable days − payable days = [ ]

One day less stock frees about           ₹[ one day of purchases ]
One day less owed by customers frees     ₹[ one day of sales ]
Talk through your books in a demo
If you would like to talk through how your business keeps its books, request a demo and choose "Book a demo" on the form. FastComply Books is in an invitation pilot in India, so the demo is where we confirm what is available for your business.